3.1 Regulatory Environment Affecting Distribution Utilities
3.1.3 US Renewable Portfolios
The regulatory environment in the US strongly affects DER interconnections. Many States have developed “Renewable Portfolio Standards” (RPS) or “Renewable Portfolio Goals” which require or incentivize the increased energy production from any of a list of renewable or alternative sources (see Figure 11). Although similarities exist throughout most states’ RPS programs, they vary significantly in terms of size, organization and execution.
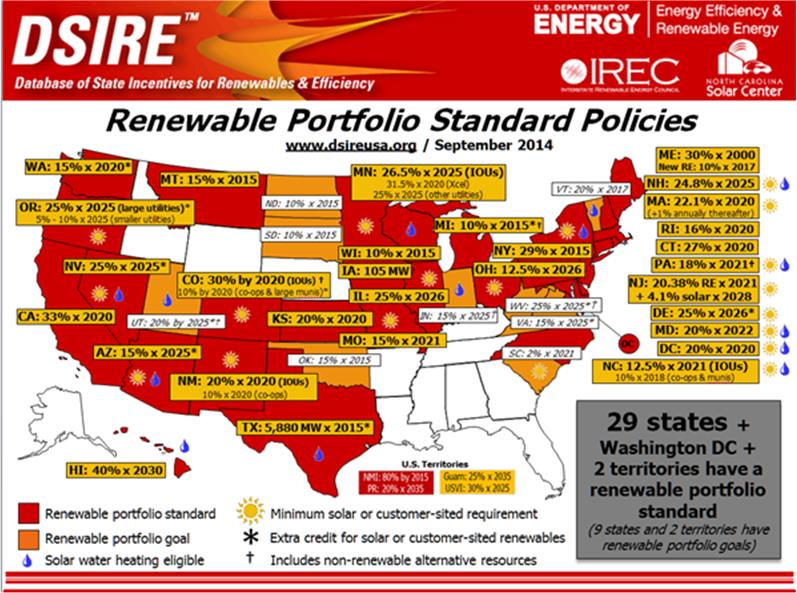
Figure 1 : Renewable Portfolio Standards and Goals for each State
For many States, concerns are raised that without governmental mandates, renewable resources cannot not initially be market competitive. Although incentives like the Federal Renewable Electricity Production Tax Credit (PTC) and the Federal Residential Renewable Energy Tax Credit were created to subsidize the deployment of renewable energy, using these credits can be problematic for a variety reasons. For instance, they only are available for a short period of time and may or may not be renewed. This causes uncertainty in the renewables suppliers and market participants.
In addition, the costs of solar and wind technologies have fallen significantly in the last decade making renewable energy more cost competitive although still not on a par with some bulk power plants. Also, the increasing availability and low cost of natural gas combined with a relatively flat electricity demand may have diluted political support for continued RPS. These changing situations are then used by skeptics of the tax credits to question whether they are still necessary.
The results of these lower costs as well as the political pressures to encourage renewable energy have had a profound effect on utility operations. Wind power and large solar plants, mainly connected to the transmission system, has grown rapidly. Even distribution system solar generation has increased from approximately 4 GW of global installed capacity in 2003 to nearly 128 GW in 2013. However, different countries have been more or less aggressive: Germany has a capacity of about 32 GW solar generation capacity out of 80 GW total generation capacity, while the US is lagging far behind in solar generation having reached only 16 GW in generation capacity in 2013 out of over 1000 GW total generation capacity, as illustrated in Figure 2.
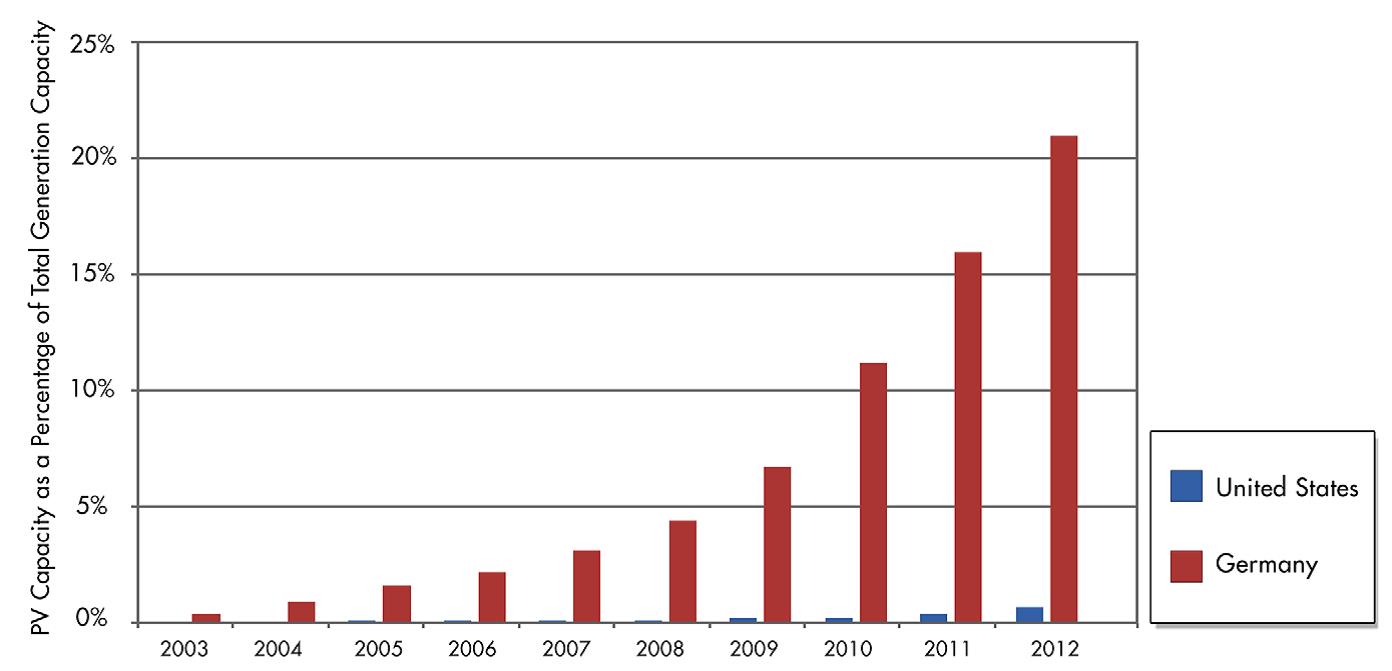
Figure 2 : U.S. PV Capacity as a Percentage of Total Capacity Compared with Germany at the Beginning of Its “Energy Transformation”
EPRI, “The Integrated Grid, Realizing the Full Value of Central and Distributed Energy Resources”, 2014 http://www.epri.com/abstracts/Pages/ProductAbstract.aspx?ProductId=000000003002002733